A 10-Year State by State Analysis of U.S. Traffic Deaths That Will Change How You Drive
Over the course of the last decade, the Fatality Analysis Reporting System (FARS) from the National Highway Traffic Safety Administration has collected data revealing striking trends in traffic-related fatalities across the United States. A closer examination of the figures from the ten year period of 2013 to 2022 uncovers a concerning rise in road fatalities across the United States.
3 Most Deadly States
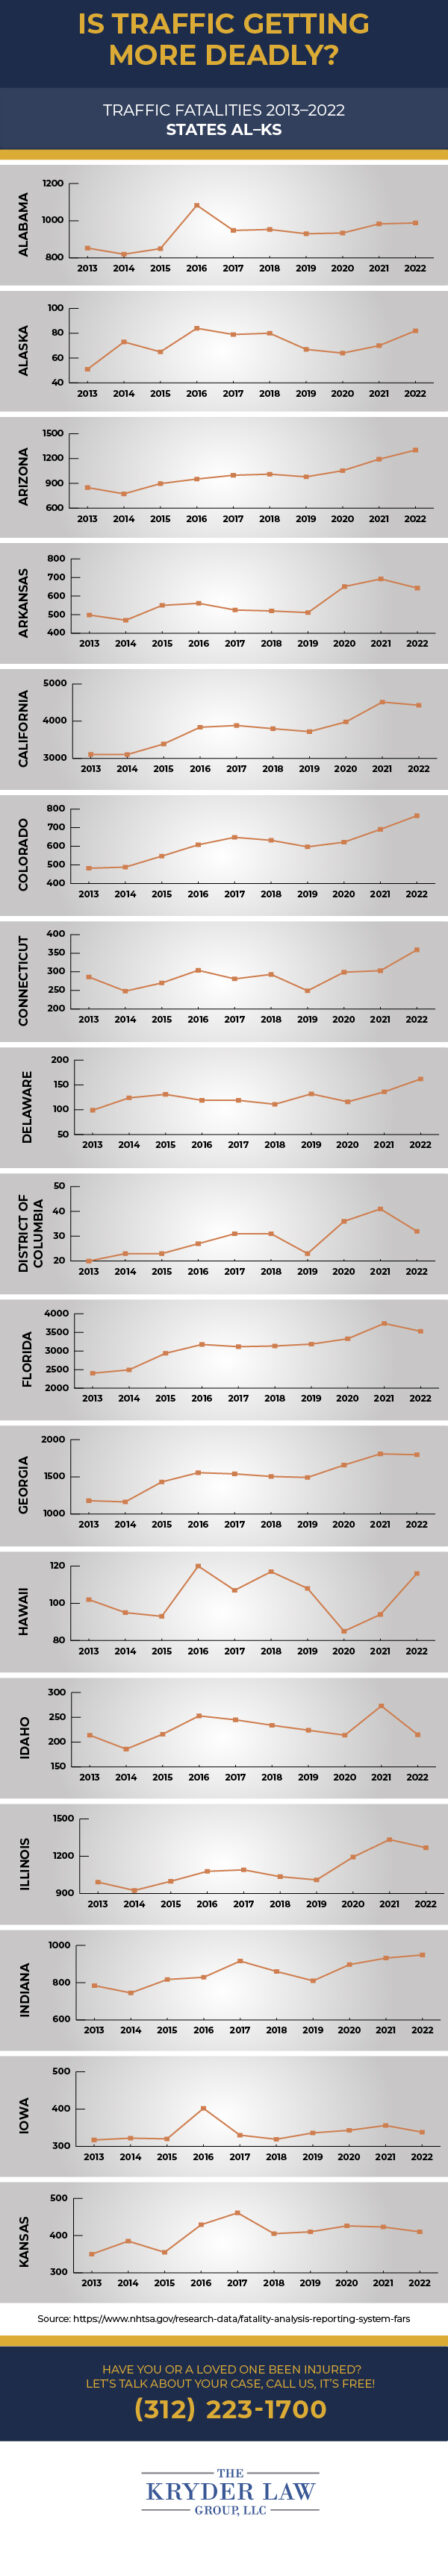
Among the states, Texas, California, and Florida stand out for having the most traffic deaths as well as an alarming increase in the number of deaths over the decade. Texas ranked #1 most deadly with a tragic 38,087 deaths and a dramatic increase in traffic fatalities, starting from 3,389 in 2013 and soaring to 4,400 in 2022. California saw a jump from 3,107 fatalities in 2013 to 4,428 in 2022, and ranked #2 most deadly with 37,755 deaths. Florida, similarly, witnessed an increase from 2,403 in 2013 to 3,530 in 2022, and ranked #3 most deadly with 31,047 deaths.
How Does Illinois Compare?
Illinois, while also experiencing an upward trend, saw a somewhat less dramatic rise in the death rate from traffic-related fatalities compared with Texas, California, and Florida. Starting at 991 deaths in 2013, Illinois witnessed a steady increase, peaking at 1,334 in 2021 before slightly decreasing to 1,268 in 2022. This pattern signifies a concerning growth, though not as steep as the aforementioned states. In addition, Illinois ranks as the 9th worst state with a total of 10,920 deaths over the decade.
“Amidst the heartbreak of road fatalities, it is our collective responsibility to pursue justice for the victims while aggressively advocating for safer roadways. Each fatality is a grim wake-up call for drivers, emphasizing the critical need for efficient and preemptive strategies to avert similar tragedies in the future.” remarks Andrew Kryder, noted Chicago car accident lawyer.
Is Traffic Getting More Deadly?
The FARS data over the past decade unequivocally suggests that traffic is becoming deadlier in the United States. The increasing number of fatalities in states such as Texas, California, and Florida is not just alarming but indicates a broader, nationwide trend towards higher road deaths. When charting the statistics between 2013 and 2022, the upward rise in fatality rate becomes visually apparent across all but 5 states and underscores the growing peril of driving on America’s roads.
States with the Most Alarming Increases in Traffic Fatalities
The data reveals a stark reality: several states have experienced traffic crash and fatality increases of over 50% within just a decade. Here are the ten states with the most significant percent changes in fatal crashes and traffic-related deaths between 2013 vs. 2022:
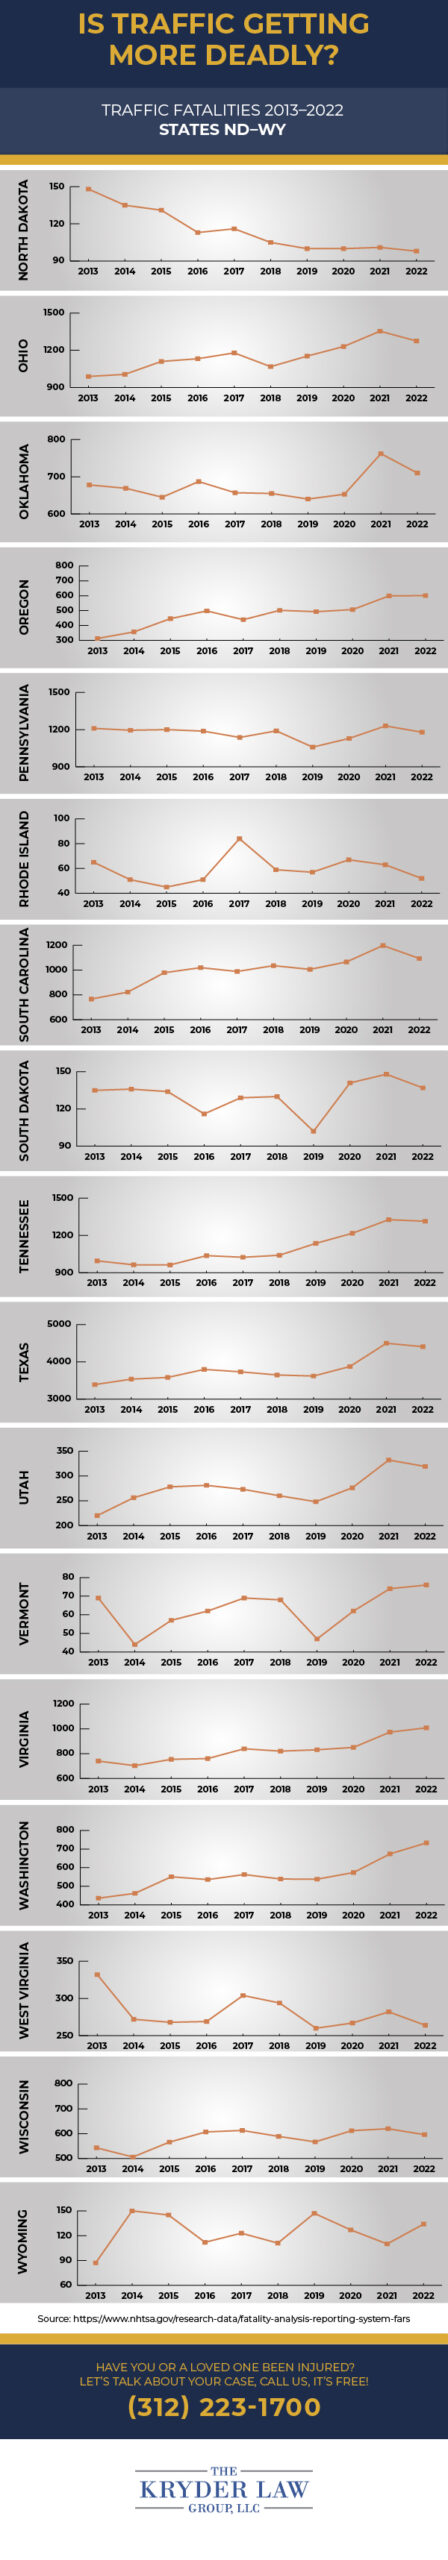
- Oregon experienced the highest percent increase, with traffic fatalities rising by 92.01%, marking the most drastic upsurge among all states.
- Washington followed with a 68.12% increase, underlying a significant escalation in road deaths.
- Delaware saw a 63.64% increase, signaling a noticeable uptick in traffic-related fatalities for car occupants and other more vulnerable road users.
- Alaska‘s fatalities rose by 60.78%, reflecting a significant concern in road safety within the state.
- The District of Columbia noted a 60% increase, a substantial rise that demands attention.
- Colorado experienced a 58.51% increase, indicating a growing trend in road fatalities.
- Nevada saw a 56.39% rise in traffic deaths, pointing to increasing dangers on its roads.
- Wyoming reported a 54.02% increase, showcasing a troubling upsurge in traffic fatalities.
- Arizona observed a 53.36% increase, reinforcing the trend of rising road deaths.
- Georgia rounded out the list with a 52.29% increase in traffic-related fatalities.
States with a 25% to 50% Increase in Traffic Fatalities
The analysis of states with a percent increase between 2013 and 2022 of 25% to 50% in traffic-related fatalities sheds light on a broader, yet equally concerning issue transcending America’s roadways. These states, experiencing substantial growth in the death rates from traffic accidents, underscore the nationwide urgency to address road safety. Here is an overview of the states within this troubling bracket:
- New Mexico witnessed a 49.84% increase in traffic fatalities, nearly reaching the 50% mark and signaling a dire need for intervention.
- Florida saw a 46.90% increase, highlighting a pressing road safety crisis in a state known for its bustling highways and tourist traffic.
- Utah‘s fatalities rose by 45%, pointing to significant road safety challenges against a backdrop of varied terrain and weather conditions.
- South Carolina experienced a 42.63% increase, underscoring a critical situation in road safety amidst growing population and tourism.
- California reported a 42.52% increase, illustrating a severe issue in a state with some of the highest volumes of road traffic in the country.
- Missouri observed a 39.63% increase in traffic deaths, signaling an underlying road safety crisis.
- Virginia noted a 36.22% increase, indicating a growing concern in a state with a complex network of highways and byways.
- Tennessee saw a 32.06% upsurge, marking a significant increase in road fatalities to be addressed.
- Texas‘ increase of 30.07% further emphasizes the critical state of road safety in one of the nation’s largest and most populated states.
- Arkansas experienced a 29.12% rise, highlighting the urgent need for enhanced road safety measures.
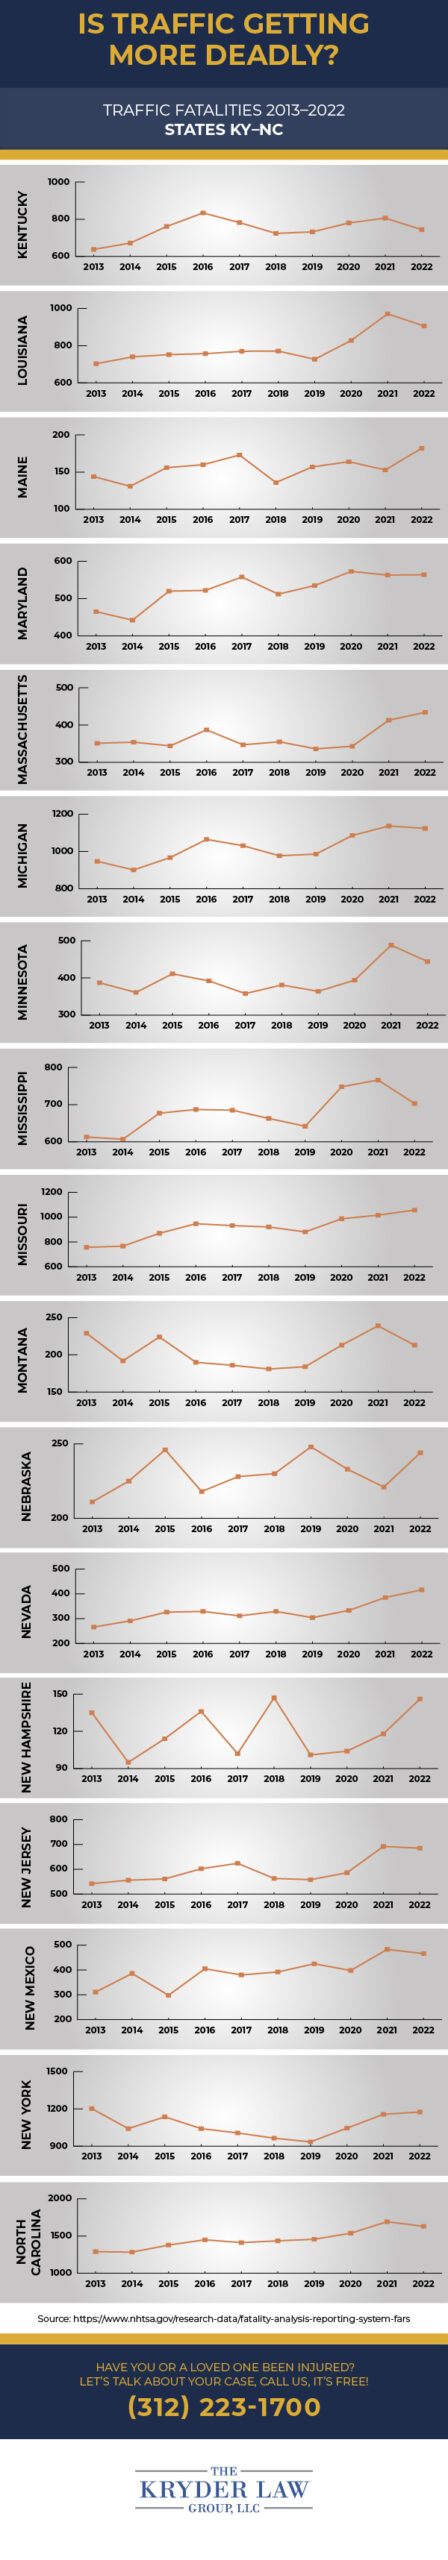
- Ohio with a 28.92% increase, Louisiana at 28.88%, Illinois with 27.95%, and Maine at 26.39%, each demonstrate significant upticks in road fatalities, calling for immediate action.
- New Jersey‘s traffic deaths rose by 26.38%, and North Carolina saw a 26.36% increase, both signaling a rising tide of road safety challenges.
- Connecticut rounds out the list with a 25.52% increase, underlining the nationwide spread of increasing traffic fatalities.
States with Smaller Increases in Traffic Fatalities
While the highlighted increases in traffic fatalities across various states are alarming, it is also essential to acknowledge the regions where the rise in road deaths has been relatively moderate. This segment focuses on states that witnessed an increase in traffic fatalities of less than 25% in 2013 vs. 2022. Though the percent increase was more moderate, these numbers still account for more than 84,000 lives tragically lost in this 10 year period.
- Massachusetts saw an increase of 23.65% in the number of deaths, which, while significant, is lower compared to many other states.
- Maryland‘s traffic fatalities rose by 21.29%, suggesting some level of control in road safety concerns.
- Indiana experienced a growth of 21.05% in road deaths, pointing towards efforts to curb the rising trend.
- Michigan reported an 18.69% increase, indicating a moderate rise in traffic-related fatalities.
- Kansas observed a 17.14% growth, showing some restraint in the rise of road-related deaths.
- Kentucky‘s fatalities went up by 16.61%, hinting at possible impacts of safety initiatives.
- Alabama witnessed a 15.83% increase, lower than the national average, showcasing efforts towards road safety.
- Nebraska experienced a 15.64% rise in traffic deaths, which is relatively modest.
- Minnesota‘s increase of 14.73% points to effective measures in place for ensuring road safety.
- Mississippi saw a 14.68% rise, indicating a slower growth in fatalities.
- Hawaii‘s fatalities went up by 13.73%, suggesting some success in managing road safety.
- Vermont reported a 10.14% increase, one of the lower rates of growth in traffic fatalities.
- Wisconsin observed a 9.76% rise, showcasing potential effectiveness of safety measures.
- New Hampshire saw an 8.15% increase, indicating a modest rise in traffic-related deaths.
- Iowa experienced a 6.62% growth, hinting at strong road safety protocols.
- Oklahoma‘s traffic deaths went up by 4.72%, one of the smallest increases across the states.
- South Dakota observed a slight increase of 1.48%, showcasing remarkable control over the rise in fatalities.
- Idaho rounds out the list with an almost negligible increase of 0.47%, indicating highly effective road safety measures or other mitigating factors.
States Trending Down
The data reflects a notable achievement in road safety within six states, each reporting a decrease in traffic fatalities between 2013 and 2022. This downward trend in traffic-related deaths is significant amidst the nationwide concern over increasing fatalities in vehicles.
- New York demonstrated progress with a -2.25% decrease, highlighting effective measures in one of the most densely populated states.
- Pennsylvania followed closely with a -2.56% reduction, indicating successful implementation of road safety policies in a state with a mix of urban and rural road networks.
- Montana, known for its rural landscapes and higher speed limits, reported a -6.99% decrease.
- Rhode Island, the smallest state by area, showed a remarkable -20% decrease.
- West Virginia also reported a -20.48% decrease, underscoring the effectiveness of safety measures in a state with challenging road conditions due to its mountainous terrain.
- North Dakota saw the most significant drop of -33.78% in motor vehicle deaths, a compelling testament to the state’s road safety efforts, particularly impressive given its rural expanses and extreme weather conditions.
The Vital Perspective on Decreased Traffic Fatalities
While the declining numbers in motor vehicle and traffic-related fatalities within states such as New York, Pennsylvania, Montana, Rhode Island, West Virginia, and North Dakota offer a glimmer of optimism, it’s crucial to underscore that each death represents a profound loss. Even with these positive trends, the numbers still reflect significant human loss, serious injuries, and thousands of lives annually affected by road incidents in these regions. For example, though New York showed a percent decrease between 2013 vs. 2022, it ranked number 10 as the state with the most deaths for this time period with almost 11,000 lives lost on the road.


 (312) 223-1700